The Connecting Tissue of Enterprise Architecture: Why TraceID is Non-Negotiable
Working in a distributed system without TraceIDs is like navigating a maze in the dark. Learn how to build the Ubiquitous Telemetry Pattern for enterprise scale.
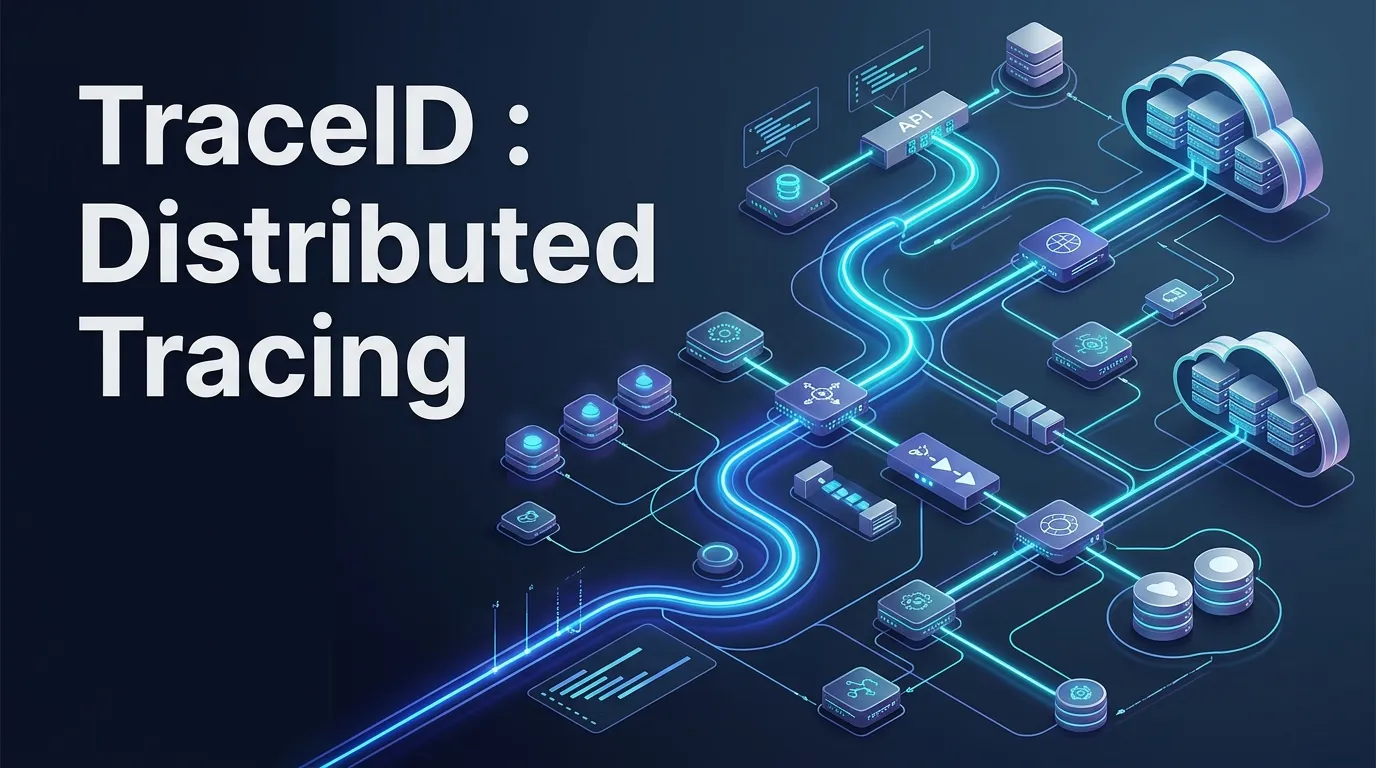
A TraceID is a globally unique, alphanumeric string assigned to a single transaction or user request at the exact moment it enters a distributed system. It acts as a digital fingerprint, propagating across all subsequent microservices, APIs, serverless functions, and databases to unify disparate logs into a single, comprehensive journey.
If you manage a modern enterprise architecture, you have likely experienced the “needle in a haystack” nightmare: a critical user transaction fails, and the only evidence is a generic 500 Internal Server Error on the frontend. As your engineering team scrambles, they are forced to dig through isolated logs across dozens of independent services.
Working in a distributed system without a unified tracking mechanism is like navigating a complex maze in the dark. In many ways, it is identical to the context degradation we see in large language models. As I discussed in my recent post on Overcoming the AI Re-Explanation Tax, a system without persistent, continuous memory across steps is doomed to reset context and fail at scale. In microservices, the TraceID is that persistent memory.
Why Do We Need TraceIDs?
In the era of monolithic applications, a request entered a single server, hit a single database, and generated a single linear log file. Today, an enterprise cloud setup is intensely fragmented.
In the world of microservices and serverless architectures, a single user action, such as clicking Buy Now, might trigger a complex chain of events across multiple independent services. The request might enter the API Gateway, be routed to an Order Service (likely a Docker container), then query a Product Catalog Service (possibly a managed AWS RDS instance), interact with Payment Service to make an external gRPC call to payment provider, and finally push a message to a Notification Service (running as a Lambda function in a different availability zone).
Without a TraceID, the logs from the API Gateway are completely isolated from the logs of the Product Catalog Service. If a failure occurs in the database query, the developer has no inherent way to link that error back to the original user request that initiated the entire chain.
This lack of correlation is the root cause of the “needle in a haystack” nightmare. Finding the root cause of a specific user-reported error often requires manually searching across different log aggregation tools, cross-referencing timestamps, and making educated guesses. This process is not only time-consuming but also impossible to scale in dynamic cloud environments where containers are constantly being created and destroyed.
A TraceID stitches these isolated events back into a coherent, end-to-end journey.
The 4 Pillars of TraceID Value
-
Drastically Reducing Mean Time to Resolution (MTTR) : When a transaction fails, engineers query a centralised log aggregator for the specific
TraceID, instantly filtering out millions of unrelated logs to see the exact microservice that threw the exception. -
Performance Bottlenecks Isolation : TraceIDs allow observability platforms to render “waterfall” charts. If a checkout takes 4 seconds, the
TraceIDreveals if the delay was a slow database query in Inventory or network latency to the Payment gateway. -
Real-Time Dependency Mapping : Because
TraceIDstrack the exact paths requests take, observability tools can use them to automatically generate real-time service dependency maps. This allows architects to see the actual architecture as it behaves in production, rather than relying on static, quickly outdated documentation. It highlights unexpected dependencies or cyclical calls that degrade system resilience. -
Immutable Auditing and Compliance : For heavily regulated enterprises like finance, healthcare, proving what happened during a specific transaction is a compliance requirement. A
TraceIDprovides an audit trail by linking events, proving that a specific payload passed through the authorization service before data was manipulated in the core ledger.
TraceID vs. SpanID vs. Correlation ID
It is important to understand the difference between these overlapping observability terms. While all three are used to track requests, they serve different purposes:
| Concept | Definition | Scope |
|---|---|---|
| TraceID | The overarching unique identifier for a complete end-to-end request. | Global (Cross-Service) |
| SpanID | The unique identifier for a single step or operation within that trace. | Local (Single Service) |
| CorrelationID | A broader business-level ID often used before W3C standards; sometimes synonymous with TraceID but lacks strict formatting rules. | Business Logic |
The Causal Hierarchy: The Span Execution Tree
While a TraceID represents the transaction’s end-to-end identity, the work performed inside each microservice is represented by a hierarchical tree of Spans. Each child span records duration, parentage, and contextual attributes:
The Enterprise Standard: The Ubiquitous Telemetry Propagation Pattern
Establishing distributed tracing in a multi-cloud environment requires shifting from treating telemetry as an operational afterthought to defining it as a strict architectural standard. When workloads span over multiple cloud providers, relying on proprietary vendor agents fragments your visibility. A request originating in one cloud and terminating in another will break the trace chain unless a universal propagation pattern is enforced.
As an Enterprise Architect defining this standard, the target state is a Ubiquitous Telemetry Propagation Pattern. This pattern decouples how telemetry is generated and transmitted from where it is ultimately stored and analysed.
This pattern is built on two open-source standards:
- The Propagation Standard : W3C Trace Context: This dictates how the
TraceIDmoves over the wire. It standardises HTTP headers (traceparentandtracestate) so that every modern cloud load balancer, API gateway, and service mesh can read, append to, and forward the identifier without stripping it.
- The Instrumentation Standard : OpenTelemetry (OTel): This dictates how applications generate the data. By mandating the
OTel SDKacross all development teams, you eliminate vendor lock-in. Code is instrumented once, and the telemetry can be routed to AWS CloudWatch, Datadog, Splunk, or any other backend without changing a single line of application code.
Defining the Multi-Cloud Architecture Pattern
To operationalise this standard, enforce the following structural rules across your enterprise deployment lifecycle:
1. The Edge Minting Rule:
TraceIDs must be generated at the absolute furthest edge of your infrastructure.
- The ingress controller, external API Gateway, or Edge CDN is responsible for checking incoming requests. If a valid
traceparentheader exist, indicating the request is already part of an ongoing trace, and hence it is honoured. If none exists, the edge component generates a new W3C-compliantTraceIDand injects it into the request header. - By minting at the global edge, it does not matter if the routing logic sends the payload to an AWS Lambda function or a container in Azure or anyother service from different cloud; the identity of the transaction is locked in before cloud-specific routing occurs.
2. The OTel Collector Sidecar Pattern:
Applications should never send telemetry directly over the internet to an observability backend like Datadog or Splunk. Instead, deploy the OpenTelemetry (OTel) Collector as an intermediary in every cloud environment. This collector is deployed as a sidecar container to the application container, ensuring that it is always available when the application is running.
- The OTel Collector acts as a universal telemetry router. It can batch, compress, and scrub sensitive data before exporting it.
- Decouples data ingestion from analysis tool vendor. If your primary cloud observability is on AWS, Collectors running in alternate clouds can securely route their traces back to your central AWS account, bypassing the need for point-to-point integrations.
3. Strict Boundary Propagation
Network boundaries between cloud providers are where traces most frequently dies.
- Any component that makes an egress call to another service, whether via HTTP/REST, gRPC, or placing a message on a Kafka Queue, must inject the current
traceparentheader into the outbound payload. - If an application in Cloud A publishes an event to an event bridge that triggers a serverless function in Cloud B, the
TraceIDtravels inside the message metadata. This stitches asynchronous, multi-cloud execution into a single, unified trace.
4. Unified Trace-Log Correlation Rule
Tracing alone only tells you where the request spent its time, not why it failed.
- Mandate structured JSON logging across all microservices, and configure logging libraries (like Log4j, Winston, or Serilog) to automatically pull the active
TraceIDfrom the OpenTelemetry context and append it as a top-level JSON field (e.g., “trace_id”: “5b8a9…”). - This correlation must be enforced at the OpenTelemetry SDK level to ensure logs are tagged before they leave the host.
Common Anti-Patterns
| Anti-Pattern | Description | The Architectural Fix |
|---|---|---|
| The Event Bus Blackhole | TraceIDs are lost when messages are pushed to asynchronous queues like Kafka or RabbitMQ. | Inject the W3C traceparent into the native message headers/metadata of the queuing system. |
| Vendor Lock-in | Baking vendor-specific code into every application file. | Standardize on OpenTelemetry SDKs; change routing exclusively at the OTel Collector level. |
| Context Stripping | Nginx or HAProxy configurations inadvertently drop unknown HTTP headers, killing the trace. | Audit network proxies to explicitly allow-list traceparent and tracestate headers. |
| The Log-Spill Pattern | Generating logs from individual containers and relying on the cloud provider’s log ingestion service to piece the trace together. | Enforce the Unified Trace-Log Correlation Rule; every log line must contain the TraceID field before leaving the host. |
| The “Silent Failure” Architecture | Using multiple disparate monitoring tools that cannot talk to each other, creating visibility gaps between services. | Adopt a unified observability platform that natively ingests Traces, Logs, and Metrics in a Single Trace Context, ensuring developers can pivot seamlessly between latency (trace) and cause (logs). |
The Architect’s Playbook: The shift in Monitoring Philosophy
To roll this out to engineering teams, you cannot just publish a wiki page and hope for the best. You must treat this pattern as an internal platform product. Provide teams with exact boundaries, zero-friction configurations, and immutable standards.
As I noted in The AI Microwave, you cannot drop advanced capabilities into a broken foundation. Observability isn’t a feature; it is the kitchen wiring required before you can scale. Instead of dictating application-level code, Enterprise Architects must govern the infrastructure boundaries and data schemas.
To fully operationalise this pattern, the enterprise must adopt a Trace-Driven Observability philosophy. This requires shifting from traditional, host-centric monitoring to a request-centric, causal-chain analysis model. Instead of monitoring CPU, memory, and disk I/O in isolation, architects design systems to answer one primary question: “Which service in the transaction path introduced latency or error?”
As an Enterprise Architect, this means standardising the architecture to expose the correct data at the correct boundaries, enabling platforms to correlate metrics, logs, and traces automatically.
The Architect’s Bottom Line
Tracing is not a developer tool. It is an architectural primitive. If you are building microservices without a Ubiquitous Telemetry Pattern, you are not building a distributed system, you are building a distributed monolith.
Key Takeaways
These key takeaways are synthesized and auto-generated by AI from the article content for quick reference.
What is the W3C Trace Context?
It is a globally standardised set of HTTP headers (traceparent and tracestate) that allows different tracing tools, cloud providers, and programming languages to pass correlation IDs across network boundaries without dropping or misinterpreting them.
Why use OpenTelemetry instead of vendor-specific SDKs?
OpenTelemetry (OTel) completely decouples your application code from your observability vendor. You instrument your codebase exactly once. If your enterprise decides to switch vendors next year, you only change the infrastructure-level OpenTelemetry Collector configuration; zero code changes are required in your microservices.
How do you handle trace propagation in asynchronous messaging like Kafka?
HTTP headers do not exist in message queues. To propagate a TraceID through Kafka, RabbitMQ, or AWS SQS, the active traceparent must be extracted from the context and injected directly into the native message metadata/headers of the queuing protocol before publishing the message.
What happens to TraceIDs when a user request moves between two different cloud providers (e.g., Azure to AWS)?
As long as both cloud providers (and the services in between) respect the W3C Trace Context headers, the TraceID propagates automatically. If the request enters the first cloud's infrastructure, the cloud's Application Gateway or Load Balancer must append its own tracestate information and forward the traceparent. When the request leaves that cloud and enters the second provider, the second provider's edge infrastructure reads the incoming traceparent and continues the trace using the same ID. This seamless handoff is the primary benefit of the W3C standard.
What is the practical difference between 'Distributed Tracing' and 'Ubiquitous Telemetry'?
Distributed Tracing refers specifically to the end-to-end correlation of a single user request across multiple services using TraceIDs. Ubiquitous Telemetry is the broader architectural strategy of implementing OpenTelemetry (traces, metrics, and logs) consistently across your entire technology stack, ensuring that every single component, whether it's a legacy monolith, a Kubernetes pod, or a serverless function, emits telemetry. You cannot achieve true distributed tracing without ubiquitous telemetry, but you can have ubiquitous telemetry (collecting metrics and logs everywhere) without implementing the specific logic for cross-service trace propagation.
What is the architectural risk of NOT implementing Ubiquitous Telemetry in a microservices environment?
The primary risk is the creation of 'Data Silos of Dysfunction.' Without a consistent telemetry layer (Logs, Metrics, Traces) implemented uniformly across the monolith, all Kubernetes services, and all serverless functions, you create blind spots. An error might occur in a serverless function, but because the monolith (the originating service) has different logging standards or lacks OpenTelemetry integration, the distributed trace ends abruptly at the API gateway. This forces your SRE team to manually SSH into containers, pull logs via CLI, and cross-reference timestamp spreadsheets to piece together a user's journey, making 'MTTR (Mean Time To Resolution)' effectively infinite.
How does Ubiquitous Telemetry help with data governance in a hybrid cloud environment?
Ubiquitous Telemetry, particularly when using OpenTelemetry (OTel), acts as a neutral data fabric that enforces consistent data schemas regardless of where the data is generated. In a hybrid cloud (e.g., on-premise data centers connected to Azure Kubernetes Service), different environments have different native logging and monitoring tools. Without OTel, sensitive data (like PII in logs) might be handled differently by the on-premise Splunk instance versus the cloud-native cloudwatch. By implementing OTel, you define a single standard for data governance at the source. You can use OTel processors to mask or redact PII before the data even leaves the container, ensuring that the same privacy rules are applied whether the code is running on a physical server or in a public cloud.